Population of Interest
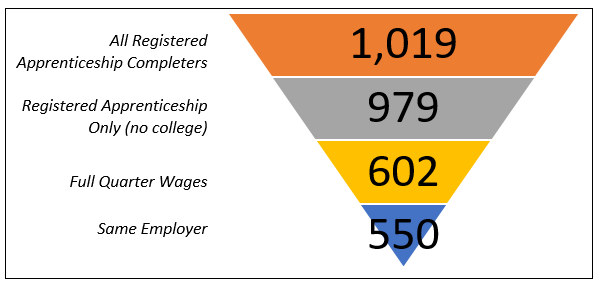
The population of interest was all Registered Apprentices completing a Maryland Apprenticeship and Training Program (MATP) through the Division of Workforce Development and Adult Learning in the Maryland Department of Labor between July 1, 2012 and June 30, 2013. Each completer is counted only once by their earliest Registered Apprenticeship completion date. All completers are included, even if that completer is currently pursuing an additional Registered Apprenticeship, enrolled at a college, or earned a college degree after completing the Registered Apprenticeship.
Throughout the report, depending on the analysis being done, the population under review will be analyzed will including the following:
Contextual Data
Two sources of data were selected to provide context for the results and guide the analysis. Collectively, these sources provide comparison points between the quarterly wage data, the cost of living in Maryland, and overall worker earnings in Maryland.
- Living Wage Calculator: The Living Wage Calculator developed by the Massachusetts Institute of Technology¹ provides data on the cost of living in various geographic areas cross the United States. The living wage calculator incorporates the cost of food, housing, health insurance, transportation, taxes, clothing and other personal items to derive the minimum annual income required for basic self-sufficiency. It is more comprehensive than traditional poverty measures, which do not incorporate these broader costs of living. More information on the MIT Living Wage Calculator is available on their website. The measure selected from the Living Wage Calculator was “required annual income before taxes” for one adult with no dependent children which was $31,365 annually or $7,841 per fiscal quarter in 2018.² This income was converted to a quarterly income to align to the MLDS quarterly wage data and is referred to as the “living wage” in the remainder of this analysis.
- ACS Median Wage: The median wage calculation for all Marylanders is based on the American Community Survey (ACS) 5 Year Estimates, 2012 to 2016.³ This survey provides extensive data on demographic characteristics, housing, and wages for states and counties throughout the United States. The measure selected from the ACS was “median earnings for workers”. This income measure was converted to quarterly earnings to align to the MLDS quarterly wage data and is referred to as the “ACS wage” in the remainder of this analysis. The ACS median earnings for workers in Maryland was $43,488 annually or $10,872 quarterly in 2018.⁴
Methodologies
Full-Quarter Wage Methodology
The completers included in the wage analysis were selected by using the U. S. Census Bureau Stable or Full-Quarter Employment Methodology (referenced as Full-Quarter throughout this report).⁵ This methodology excludes individuals from the median calculation who do not have wage data in either the fiscal quarter before or after the period of interest. For this study, the period of interest is the 20th quarter after completion or fiscal quarter 2 of 2018.⁶
Accordingly, individuals were included in the median wage calculation if, in addition to having wages in quarter 2 of 2018, they also had wages in fiscal quarter 1 of 2018 and fiscal quarter 3 of 2018. The Full-Quarter Methodology was used because it provides a standardized method of determining whose wages to include in the analysis. Restricting analysis to “stable wage earners” provides a clearer picture of wage outcomes for workers fully engaged in the workforce and eliminates the potential to deflate median wage calculations by including the wages, or lack of wages, of workers for who are absent, transient, or not fully engaged in the workforce. This method also reduces the impact of UI wage data limitations by excluding wages that may be incorrect due to incomplete or late filings.
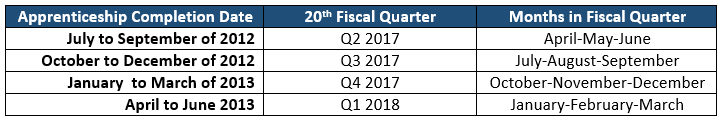
Registered Apprenticeship completion dates occurred throughout the entire 12 month period of July 2012 to June 2013. In the table below provides the alignment of completion date to the 20th quarter used for this report. This alignment means that some completers who completed their Registered Apprenticeship in the first or second month of the fiscal quarter have an additional 4 to 8 weeks of time between completion and the start of the 20th fiscal quarter to secure post-completion employment as compared to those who complete their Registered Apprenticeship at the end of period.
Methodology - Same Employer Wages
The industry of employment was determined by evaluating the North American Industry Classification System (NAICS) code reported with each wage record. NAICS codes were grouped according to standard reporting categories.⁷ The U.S. Census Bureau Stable or Full-Quarter Employment Methodology⁸ was used as a basis for selecting completers to include in the analysis with the added requirement that they must have been employed by the same employer for the nine month period (Q1 of 2018, Q2 of 2018 and Q3 of 2018) before deriving median wage calculations for fiscal quarter 2 of 2018⁹ (referenced as Same-Employer throughout this report).
Methodology - Educational Attainment
For this report, the following educational groups were created.
- Registered Apprenticeship Only: Completers who have not completed additional Registered Apprenticeship programs or pursued postsecondary education in the five year period after completing a Registered Apprenticeship. Note, due to data limitations, some Registered Apprenticeship completers may have completed Registered Apprenticeships that pre-date the 2012-2013 completion or pursued postsecondary educations prior to the 2012-2013 Registered Apprenticeship. MLDS Center data begin in 2007-2008 therefore some Registered Apprenticeship or postsecondary education may have been completed prior to the time period of MLDS Center data. Additionally, some completers may have begun a subsequent Registered Apprenticeship but not completed it, data on those who start but do not finish Registered Apprenticeships are not yet available in the MLDS system. Finally, the Maryland Higher Education Commission (MHEC) does not currently collect data from colleges on noncredit workforce education. It is possible that some completers participated in these programs.
- Some College or College Degree: Completers who enrolled in college for at least one term after completing the Registered Apprenticeship, earned a college degree, or are still enrolled in college between fall 2012 and spring 2017.
Methodology - Race and Ethnic Group Assigment
Assignment to racial and ethnic groups was made based upon the methodology used by the U. S. Census for its Current Population Survey (CPS) which reports race independent of ethnicity. The racial and ethnic groups included in this analysis align to standard reporting practices employed by the U.S. Bureau of Labor Statistics (BLS). BLS reports labor data for three racial groups: White alone, Black or African-American alone, and Asian alone. Each racial group consists of individuals that identify with a single race but may be of any ethnicity. All other racial groups, including individuals identifying with two or more races, are omitted from BLS reports due to the small population size. Small populations limit the conclusions that can be drawn from the data and may compromise the quality of any research.
Footnotes
- Glasmeier, Amy K. (2018). Living Wage Calculator. (http://livingwage.mit.edu/) Massachusetts Institute of Technology.
- Values reported in the Living Wage Calculator were $31,365 annually in 2018 dollars. This was divided to a quarterly wage of $7,841 in 2018 dollars. This value did not need to be adjusted for inflation as it is contemporary to the period under study.
- United States Census Bureau. (2016). 2012-2016 American Community Survey 5-Year Estimates. U.S. Census Bureau’s American Community Survey Office. https://factfinder.census.gov
- Values reported in the ACS were $40,893 annually in 2016 dollars. This was divided to a quarterly wage of $10,223 in 2016 dollars. The values were inflation adjusted to 2018 dollars using the CPI Inflation Calculator provided by the U. S. Department of Labor, Bureau of Labor Statistics -https://www.bls.gov/data/inflation_calculator.htm.
- The Full-Quarter Employment (Stable) methodology is utilized by the U. S. Census Bureau to calculate average monthly earnings for individuals engaged in stable employment with any employer. The methodology is applied here to derive quarterly, rather than monthly median earnings. https://lehd.ces.census.gov/doc/QWI_101.pdf.
- Some individuals have wages in a quarter from more than one employer. Those wages were summed and then the sum was used in the median quarterly wage calculation.
- The 20 NAICS codes were grouped based upon industry sector as aligned to U. S. Bureau of Labor Statistics and U.S. Statistical Agencies Office of Management and Budget (Federal), Economic Classification Policy Committee.
- The Full-Quarter Employment (Stable) methodology is utilized by the U.S. Census Bureau to calculate average monthly earnings for individuals engaged in stable employment with the same employer. The methodology applied here derives quarterly, rather than monthly, median earnings. https://lehd.ces.census.gov/doc/QWI_101.pdf.
- For the NAICS quarterly median wage calculation, some individuals had wages in the quarter from more than one employer and more than one NAICS. Only wages from the employer that covered all three quarters were used in median wage calculations.