Summary
A lot of research and attention has been paid to high school dropouts. However, the MLDS Center’s
Research Branch has identified another, larger group of students—high school persisters—who had
heretofore, been overlooked. High school persisters are students who have not earned a diploma but are still enrolled after the end of their fourth year of high school, often continuing for a fifth and even sixth year of high school. The terms dropout and persister both describe students who do not graduate high school in four years. However, persisters are unique in that they remain in high school with the apparent motivation to achieve a diploma. Understanding who persisters are and how they are different from dropouts will allow policymakers to begin to tailor interventions to assist them in achieving high school completion and postsecondary and/or workforce success.
Accordingly, this report looks at the similarities and/or differences, in terms of demographic
characteristics, academic preparation, and key life outcomes, we may find when comparing persisters and dropouts. Using data from the Maryland Longitudinal Data System (MLDS), this study used descriptive statistics, data visualization, and multilevel modeling to examine the differences between persisters and dropouts.
- We identified several student- (i.e. race, special education participation, previous dropout,
standardized test scores, on-track status, and attendance) and school- (i.e. school type, school size) level characteristics that related to the odds of persisting and dropping out in students’ fourth year of high school. - Additionally, we used a descriptive approach to illustrate the near-term academic, postsecondary enrollment, and workforce pathways of 4-year non-graduates.
- Our findings highlight the unique characteristics and outcomes of persisting non-graduates and underscore an enhanced understanding of non-graduation through examining both persisting students and dropouts.
Spotlight Contents
Understanding near-term academic and workforce experiences for students who do not graduate high school in four years can help Maryland policymakers determine the best way to direct programs and policies to try to improve both on-time and late high school graduation as well as subsequent postsecondary and workforce outcomes. For more detail, read the following sections:
- Demographic Differences Between Persisters and Dropouts
- Post-Year 4 High School Enrollment and Graduation Outcomes
- Year 6 Participation in Postsecondary and Early Workforce
- Predicting Persistence versus Dropout in Year 4
- Policy and Practice Implications
- Method and Measures
Demographic Differences Between Persisters and Dropouts
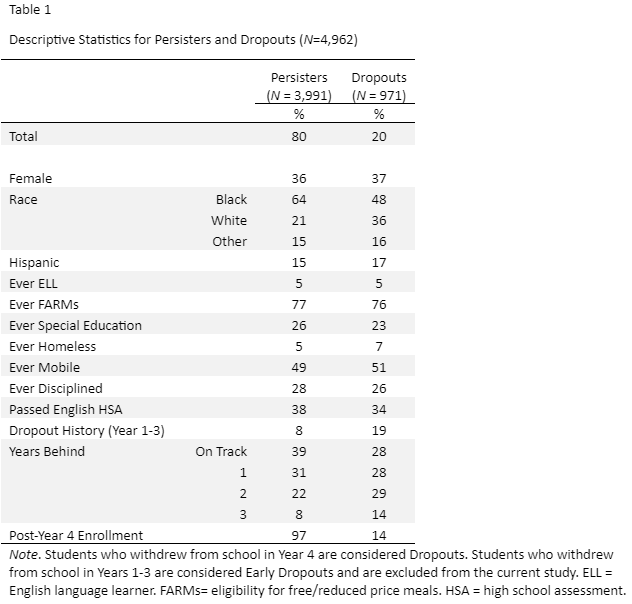
Table 1 displays the results examining the demographic differences between persisters and dropouts. Among high school nongraduates who attended at least some school in Year 4, a higher proportion were still enrolled at the end of Year 4 (i.e. were persisters; 80%) than had dropped out in the fourth year (i.e. were dropouts; 20%).
Persisters and Year 4 dropouts had similar proportions (within 2 percentage points) of
- Female students
- Students in the Other Race category
- Hispanic students
- Students eligible for English Language Learner services during high school
- Students eligible for FARMs during high school
- Students who reported experiencing homelessness at least once during high school
- Students with one or more incidents of suspension or expulsion during high school
Compared to students who dropped out in Year 4, persisters had a higher proportion of
- Black students
- Students who had received Special Education Services during high school
- Students who had passed the English Language Arts High School Assessment by the beginning of Year 4
- Students who had sufficient credits to be an 11th or 12th grader at the start of Year 4
- Student who continued their enrollment in Summer or Year 5
Compared to students who dropped out in Year 4, persisters had a lower proportion of
- White students
- Students who had changed schools during high school
- Students who had dropped out during the first 3 years of high school
- Students who had not earned sufficient credits to be promoted beyond 9th or 10th grader at the start of Year 4
Post-Year 4 High School Enrollment and Graduation Outcomes
Overall, about four-fifths (81%) of persisting students and Year 4 dropouts enrolled–or re enrolled– in, and attended, at least one day at a Maryland high school in the summer immediately post-Year 4 or Year 5. Fourth year persisters, however, enrolled in summer or Year 5 at a substantially higher rate (97%) than dropouts (14%; see Figure 1).
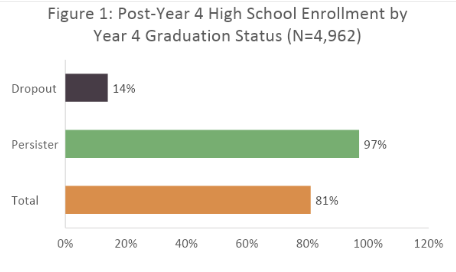
Among high school nongraduates who attended at least some school in Year 4, one in five students (81%) had post Year 4 enrollment (i.e. Year 4 summer or Year 5). A higher proportion of persisters (97%) had post Year 4 enrollment compared to students who had dropped (14%).
We also examined the Year 5 graduation outcomes for persisters and dropouts (see Figure 2). By the end of the fifth year, over one-third (38%) of the 4th year non-graduates had earned a regular high school diploma from a Maryland public high school and 4% had earned a diploma via GED. However, more than half (58%) of the 4th year non-graduates had not earned any high school credential by the end of Year 5. Nearly half (47%) of persisters earned a high school diploma compared to fewer than 1 in 20 (4%) of dropouts. Dropouts did however earn Maryland diplomas via GEDs at a substantially higher rate (15%) than persisters (2%). Critically, 4 out of 5 (81%) dropouts and just over half (52%) of persisters did not earn a credential by the end of Year 5.
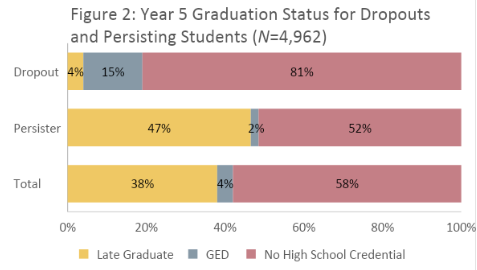
Among high school nongraduates who attended at least some school in Year 4, most students who did go on to earn a high school credential (42%) earned a high school diploma (38%). Persisters earned high school credentials at a much higher rate (47% diploma, 2% GED) than dropouts (4% diploma, 15% GED). At the end of Year 5, four-fifths of dropouts (81%) and just over half of persisters (52%) had earned no high school credential.
Year 6 Participation in Postsecondary and Early Workforce
Next, we examined patterns of enrollment and postsecondary participation as well as early workforce participation in Year 6 by Year 5 high school completion status. Just under one-fifth of late graduates (18%) and diploma via GED earners (21%) were enrolled in a postsecondary institution in Year 6 compared to 3% of students who had not yet earned a high school credential (Figure 3). During the sixth year, almost half of diploma via GED earners (44%) and two-fifths of late graduates (38%) worked three or more financial quarters in Maryland’s formal, non-federal economy, compared to less than a quarter of students with no earned high school credential (23%). About half of the late graduates (47%) and diploma via GED earners (45%) did not enroll in postsecondary or work at least 3 quarters during Year 6 compared to three-fourths (75%) of students with no earned high school credential.
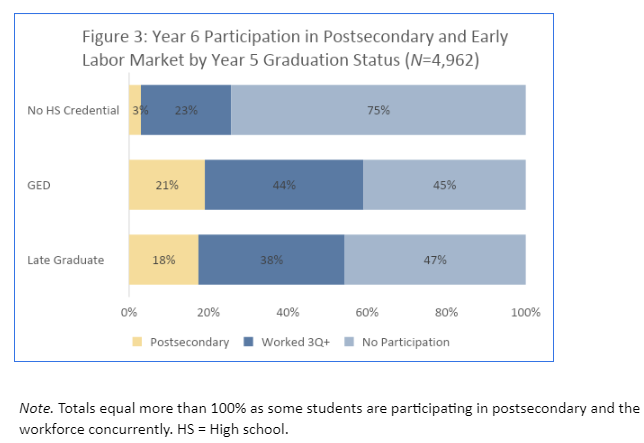
In Year 6, Late graduates and GED earners had similar rates of participation in postsecondary (18% and 21% respectively) and the labor market (38% and 44% respectively), with GED earners slightly outperforming late graduates. Three quarters (75%) of students who had not earned a high school credential by the end of Year 6 had no participation in postsecondary or the labor market.
Findings
Finally, multilevel modeling was used to examine the predictors of dropout and persisting among fourth-year high school non-completers. Figure 4 presents an illustration of the odds ratios and corresponding 95% confidence intervals for the student- and school-level factors included in the final model. For each predictor variable, the dot represents the odds ratio (i.e. the change in likelihood of persisting versus dropping out) and the solid line represents the upper and lower confidence intervals (i.e. range of plausible values for the odds ratio). If the confidence interval crosses one—represented by the perpendicular dotted line—the predictor variable was not significantly related to the odds of persisting versus dropping out (p> .05). When the confidence interval does not cross one, the predictor variable was significantly related to the odds of persisting versus dropping out (p< .05). When the odds ratio is larger than one, that variable is significantly related to higher odds of persisting. When the odds ratio is less than one, the variable was significantly related to reduced odds of persisting.
After controlling for other variables in the model, multiple student-level variables that were related to the odds of persisting or dropping out at the end of Year 4 were identified:
- Black students were more likely than their White peers to be persisters than to have dropped out by the end of Year 4.
- Special education students were more likely to persist than to drop out.
- Students who passed their English HSA by the beginning of Year 4 were more likely to persist than to drop out.
- Students who had dropped out early (years 1-3), but reenrolled by Year 4 were less likely to be persisters (i.e. more likely to drop out) in Year 4.
- Students who were behind in credits by one year (or more) were less likely to persist than to have dropped out by the end of Year 4.
- Students who had a history of chronic absenteeism were less likely to persist than to have dropped out by the end of Year 4.
In addition, after controlling for other variables in the model, multiple school-level variables were related to the odds of persisting or dropping out at the end of Year 4:
- Students who attended a combined or a Vocational-Technical high school had increased odds of persisting versus dropping out in Year 4 compared to those who attended a traditional high school.
- School size was related to the odds of persisting versus dropout, such that students who attended larger schools had higher odds of persisting.
- Notably, after controlling for other variables in the model, there was no relationship between attending an alternative or charter school and the odds of persisting versus dropout.
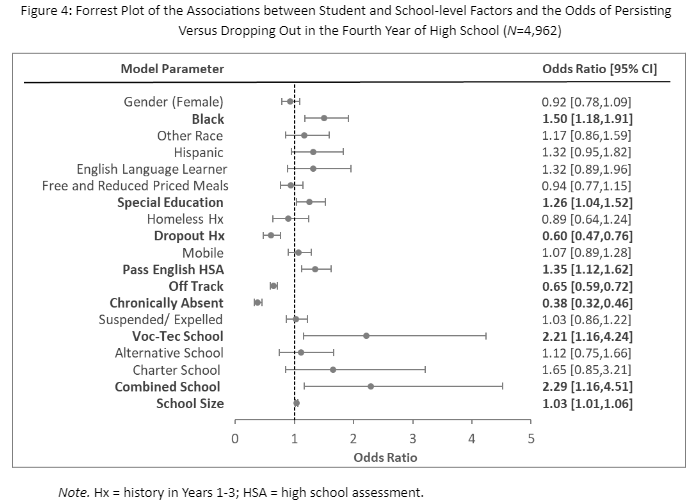
After controlling for other variables in the model we found that Black students (as compared to White students), students who received special education services, and Students who passed their English HSA by the beginning of Year 4 were more likely to persist than to drop out. We also found that students who had previously dropped out (years 1-3), students who were behind in credits by one year (or more), and students with a history of chronic absenteeism were less likely to persist than to have dropped out by the end of Year 4.
In addition, multiple school-level variables were related to increased odds of persisting or dropping out at the end of Year 4, including attending a Vocational-Technical or a Combined (i.e. 6-12th grade) high school (compared to those who attended a traditional high school). In addition, students who attended larger schools had higher odds of persisting versus dropout.
Policy Implications
There is no current policy in the State of Maryland that specifically identifies persisting students or considers their educational or workforce needs. Our findings, highlighting the unique characteristics and post-secondary outcomes of persisting students, as well as the relatively large size of this group, underscore the need for the State to consider persisting alongside dropout when developing policies aimed at increasing high school completion and promoting positive postsecondary and workforce outcomes. Persisters likely benefit from policies aimed at preventing dropout, but our findings suggest that a shift to invest public resources specifically for persisting students would help to improve graduation rates and subsequent academic and workforce outcomes. Some persisting students may need minimal academic support and coaching to complete the requirements for a diploma in the summer or fall following their fourth year of high school. Others may have more complicated needs as they approach emerging adulthood (e.g., parenting, learning challenges, homelessness) that would require additional resources and intervention (e.g. case management, wraparound services) that may stretch into their fifth or even sixth year of high school. Students who persist this long likely also need social-emotional supports as they become cut off from their former peers who have gone on to college or career.
A critical first step towards developing and assessing the efficacy of interventions for persisters would be establishing policy to define persisting students, explicitly identify them in administrative data systems, and consider expanding the MD Report Card to include them as a subgroup. This would allow educators to estimate the prevalence of persisting students in their schools and match interventions to the students’ educational needs.
Method and Measures
This study first used descriptive statistics to describe the patterns of academic and early workforce participation for four-year non-graduates including identifying patterns in students’ fifth and sixth year academic, postsecondary and early workforce outcomes. Next, multilevel modeling with students nested within high schoolsa was used to examine the student- and school-level predictors of dropout versus persisting among fourth-year high school students.
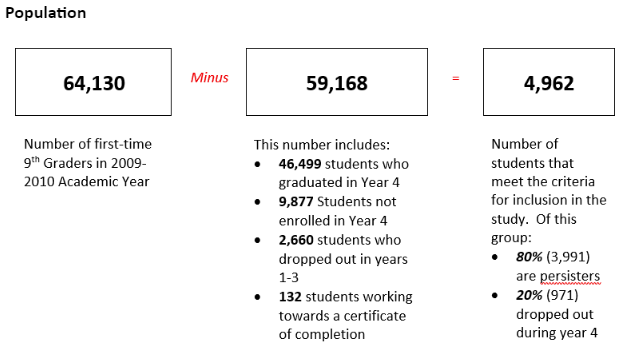
This study included students enrolled in a Maryland public high school as a first-time 9th grade student for a period of 90 days or more in Year 1 (academic year 2009-10) and attended a Maryland high school in Years 4 (2012-13) or 5 (2013-14). From this cohort of 64,130 students the analysis excluded:
- 12,537 students who were not enrolled in a Maryland public high school in Year 4, including 2,660 students who dropped out in Years 1-3 (early dropoutsb) and did not reenroll in a Maryland public school by the end of Year 4;
- 132 students who were working towards a certificate of completion rather than a regular high school diploma; and
- 46,499 students who graduated in Year 4.
After applying the exclusion criteria, 4,962 students met the final inclusion criteria, constituting a cohort of students who attended a Maryland public high school in Year 4 or 5, and either dropped out or persisted toward a high school diploma. Of those students 20% (n=971) dropped out during Year 4 and 80% were persisters (n=3,991). It is important to note that students identified as “dropping out” could later re-enroll. In addition, the current study used data collected before Maryland raised the age of required school attendance from 16 to 18. Table 1 shows the demographic characteristics for persisters and dropouts.
a. This study controlled for the third level of nesting (schools within districts).
b. Early dropouts (students who dropout prior to year 4) do not reengage with high school in large numbers (2%), so this analysis focused on examining and improving our understanding of Year 4 dropouts and persisting students.
Measures
Outcome Variables
Post-Year 4 High School Enrollment indicates that a student enrolled in a Maryland public high school during the summer or academic year immediately following their expected graduation date.
Late graduation indicates whether or not a student completed the requirements for a Maryland high school diploma after their expected graduation date, but before August 1, 2014 (Year 5).
GED indicates whether or not a student completed the requirements for a Maryland diploma via GED before June 2014.
Persister indicates that a student was still enrolled on their expected graduation date, but had not earned a regular high school diploma.
Year 4 Dropout indicates that a student formally withdrew from school without reenrolling in a degree granting program in their 4th year of high school.
Workforce participation indicates that a student worked 3 or more financial quarters in Year 6. The available data includes students working for employers in Maryland subject to unemployment insurance. The data do not include workforce participation for military service, federal government employment, self-employment, or independent contractors.
Postsecondary enrollment indicates that a student enrolled in a Maryland or out-of-state postsecondary institution during Year 6.
Student Characteristics Used in Multilevel Model Predicting Persisting and Dropout
Student-level characteristics measured in high school were used to predict the odds of persisting and dropping out. The variables examined included gender (male vs. female), Hispanic, English learner, Free and Reduced Priced Meals (FARMs) eligible (i.e. households with incomes at or below 185% of the federal poverty level or eligible for programs including migrant, homeless, and foster care), special education service receipt, and being identified as having experienced homelessness by their school system. Three dummy variables were created for race (Black, White, and Other-race).
Mobility was calculated by assessing whether a student changed schools at least once during the study period. Indicators for whether a student had dropped out of high school in Years 1-3, was chronically absent (i.e. attended < 80% of days in a school year), or had ever been disciplined (i.e. suspended or expelled) were included. To describe student academic performance, a variable describing whether a student was on-track (i.e. had enough credits to be a 12th grader in Year 4) and if not, how many years behind, in terms of credits, the student was at the beginning of Year 4 were created. Secondly, a variable indicating whether the student had passed the English high school assessment (HSA; an end of course exam that was required for graduation in Maryland) by the beginning of Year 4 was created.
High School Characteristics Used in Multilevel Model Predicting Persisting and Dropout
School type (i.e. Traditional High school, Combined School, Vocational-Technical School, Alternative School, or Charter School). There was a total of 198 schools in the sample, of which 70% were traditional high schools, 7% were combined schools, 7% were vocational schools, 11% were alternative schools, and 6% were charter schools. School size (i.e. the total student-population) was included as well.