Long-term Effects of Attending High-Poverty Schools

Children who grow up in poverty score lower on standardized tests, earn worse grades, are less likely to graduate from high school, and are less likely to enroll in college. Because of neighborhood segregation, students living in poverty tend to attend schools with other children who are also living in poverty. But does attending a high poverty school affect students’ outcomes, apart from the role of their own household poverty? By using statistical modeling, this study demonstrated the significant negative impact that school concentration of poverty has on long-term outcomes
Understanding the role of school concentration of poverty can help Maryland policymakers determine the best way to direct programs and policies to try to help. For more detail, read the following sections:
For more information, including additional outcomes not detailed in this Spotlight, see the full report here.
This spotlight provides a summary of the MLDS Center research report on Student and School Concentrated Poverty in Maryland.This report was authored by Dr. Angela Henneberger, Director of the MLDS Center Research Branch and Research Assistant Professor at the University of Maryland,School of Social Work; Dr. Bess Rose, a member of Research Branch at the MLDS Center and a Statistician at the University of Maryland, School of Social Work; Dr. Dawnsha Mushonga, a member of the Research Branch at the MLDS Center and an Assistant Professor at the University of Baltimore; Dr. Boyoung Nam, Assistant Professor in the Department of Social Welfareat Yonsei University in Seoul, South Korea and prior Research Assistant with the MLDS Center; and Alison Preston, Research Analyst at the University of Maryland, School of Social Work.
Questions or feedback can be sent to Dr. Angela Henneberger or Dr. Bess Rose.
This study used statistical modeling to estimate the impact of school concentration of poverty on each outcome, controlling for students’household poverty, students’ race/ethnicity and school racial/ethnic composition. Outcomes included high school graduation, college enrollment, and wages earned during the first year after high school.
The researchers then used the model results to calculate predicted outcomes for the following different types of students, holding school racial/ethnic composition constant:
The researchers used the model estimates for the roles of race/ethnicity to calculate these predictions for each racial/ethnic group. All of these predictions are for students in schools with average racial/ethnic compositions.
This study used a cohort of all students enrolled in 6th grade in Maryland publicschools during the 2007-08 academic year. From this cohort of 63,282 studentsthe analysis excluded:
Students who dropped out of school (whether officially or unofficially, from 9th grade onward) were included in the study.
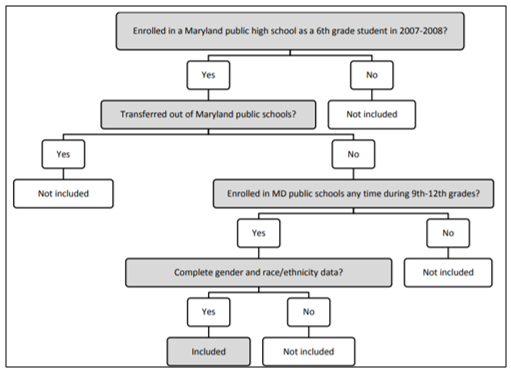
Figure 1. Decision tree for inclusion and exclusion of students from study.
The final analytic sample consisted of 54,465 students. Figure 2 is a table showing some of their characteristics.
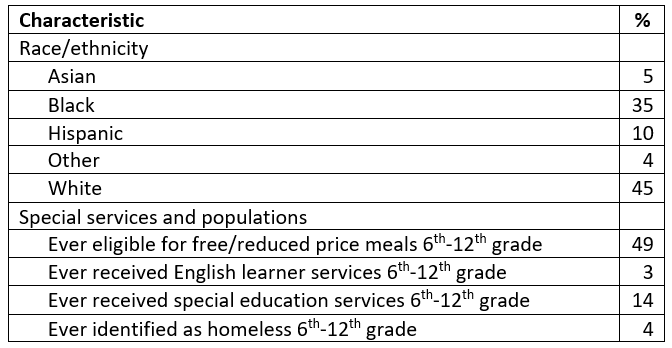
Figure 2. Characteristics of the study sample. Race/ethnicity percentages do not sum to 100 due to rounding.
To determine each student’s household poverty status, the study used data collected in accordance with the National School Lunch Program, which defines eligibility for free or reduced-price meals (FARMS) based on income and provides eligible students with meals at school. Figure 3 illustrates the household income thresholds for the federal poverty level, eligibility for free and reduced meals, and the median household income in MD for comparison.

Figure 3. Household income thresholds for the 2016-2017 school year for a family of four.
Students who want to participate in the meals program must apply each year. For this study, researchers looked at the number of years(during 6th through 12th grade) that a student was eligible for FARMS, which is referred to as student poverty duration or just student poverty. The average length of student poverty was 0.36; in other words, the average student was eligible for FARMS 36% of the time from 6th through 12th grade.
School poverty was calculated for each school and each school year based on the average proportion of time students in that school had been eligible for FARMS up to that point in time. Since most students attended more than one school between 6th and 12th grades, the study used the mean of school poverty across all schools attended by the student. The overall average school poverty was 0.37.
In the U.S., household poverty is more prevalent among minority households. Figure 4 shows the average duration of household poverty (proportion of time students were eligible for FARMS) between 6th and 12th grade by race/ethnicity. Black and Hispanic students had the highest student poverty, living in poor households 57% of the time on average.
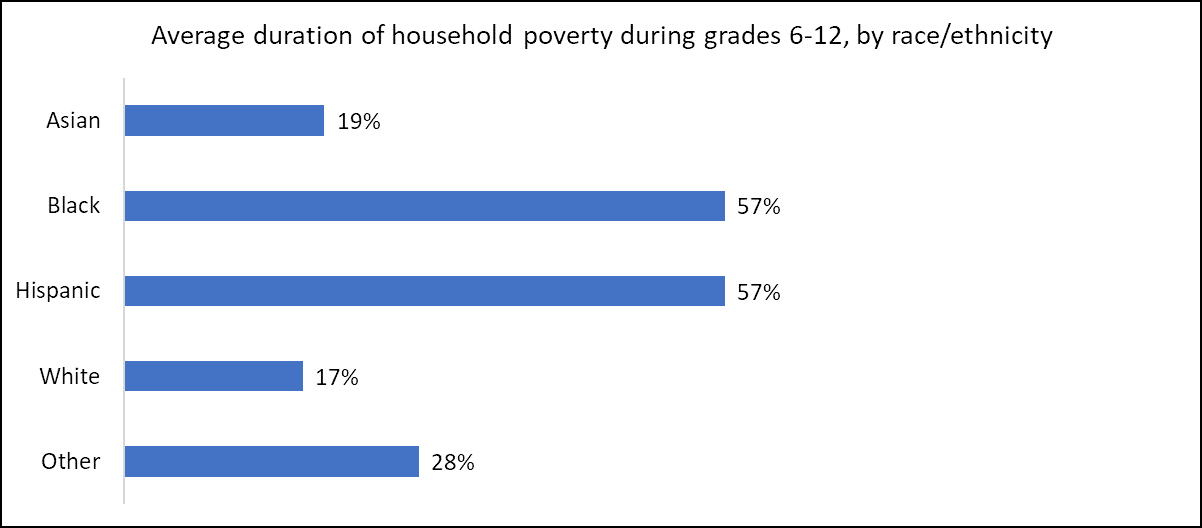
Figure 4. Average duration of household poverty during grades 6-12, by race/ethnicity.
School-level measures of race/ethnicity were also calculated for each school for each year by calculating the proportion of students in the school who were Asian, Black, Hispanic, White, and Other. Each student’s measure of school context was measured by calculating the mean school race/ethnicity across all schools attended by the student from 6th to 12th grade. Because of residential segregation by poverty and by race/ethnicity,public schools tend to be segregated by poverty and race/ethnicity, so that minority and poor students tend to attend schools with other children who are also minorities from impoverished backgrounds. Figure 5 below shows the race/ethnicity breakdown for schools, by school concentration of poverty. Schools with lower levels of poverty had higher percentages of White students, whereas schools with higher levels of poverty had higher percentages of Black students.For example, the left vertical bar represents the lowest poverty schools. These are the schools where the average student was in poverty only zero to ten percent of the time. The race/ethnicity breakdown for these schools is 10% Asian, 5% Black, 5% Hispanic, 78% White and 2% Other. By comparison, the highest poverty schools (the bar farthest on the right), where the average student was in poverty 80 to 100 percent of the time, had a race/ethnicity breakdown of 1% Asian, 89% Black, 4% Hispanic, 5% White and 1% Other.
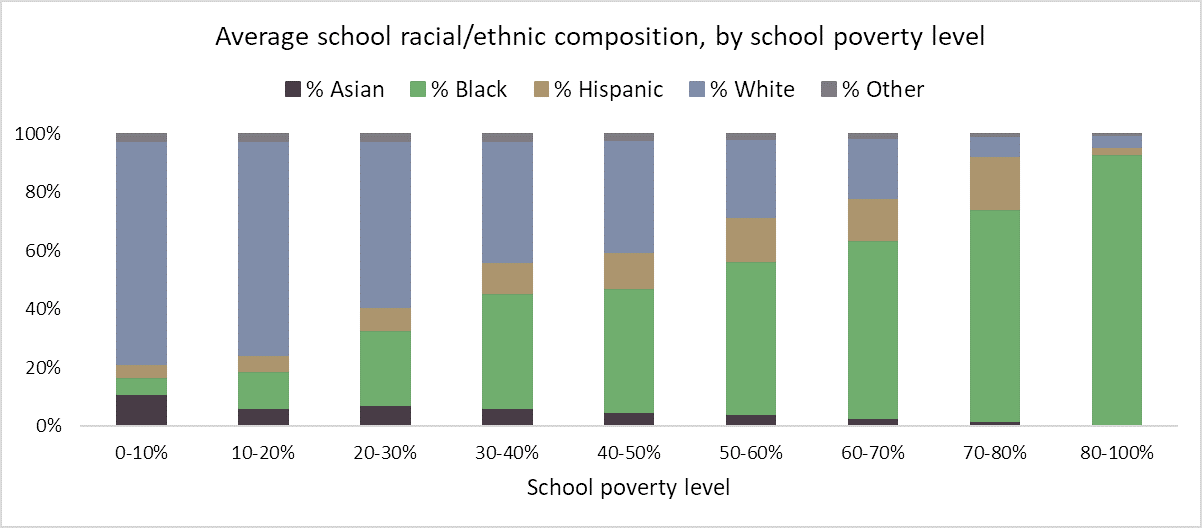
Figure 5. Average School racial/ethnic composition, by school poverty level.
Overall, attending higher poverty schools means a student is less likely to graduate from high school on time. After controlling for poverty and school composition,minority students are more likely to graduate from high school on time. Figure 6 shows the predicted likelihood of on-time high school graduation by levels of students’ household poverty and school concentration of poverty. Comparing the red,yellow, and blue bars illustrates the effects of student-level poverty and school concentrated poverty. For White students (left side of graph), those with average poverty experiences (red bar) have an 88% likelihood of on-time high school graduation. White students with high student poverty (yellow bar) have an 81% likelihood of graduating on time. White students with both high student and school poverty (wavy bar) have only a 54% probability of on-time high school graduation. Students in other race/ethnicity groups have different predictions based on the model estimates of the role of race/ethnicity. Black,Hispanic, and Asian students are predicted to have slightly higher likelihood of on-time graduation than White students after controlling for poverty and school composition.
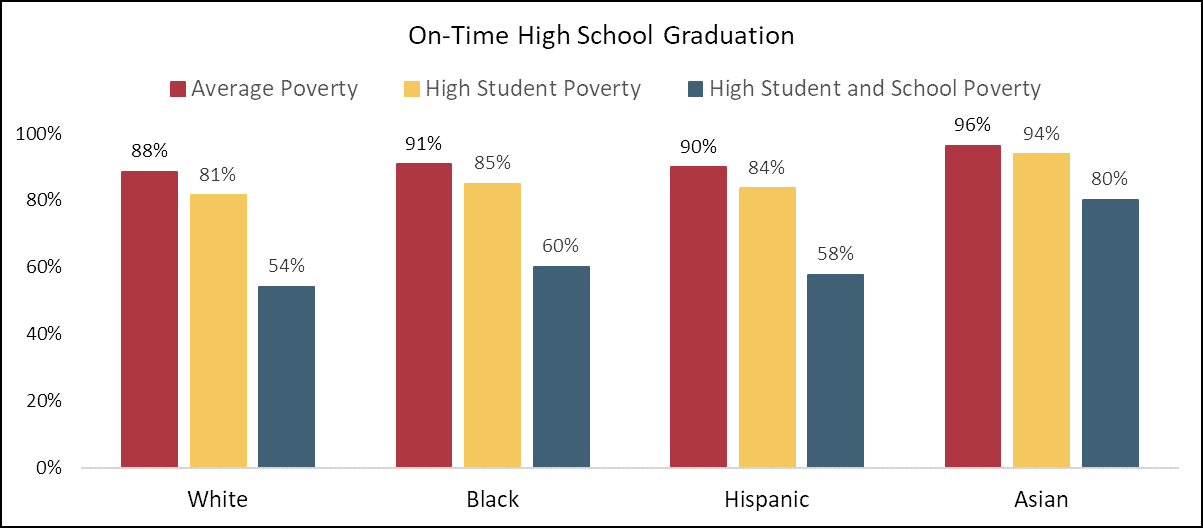
Figure 6. Predicted likelihood of on-time high school graduation, by race/ethnicity and poverty (average poverty, high student poverty, and high student and school poverty), for students in schools with average racial/ethnic composition.
Overall, attending higher poverty schools means a student is likely to receive lower scores on standardized tests like the high school Algebra assessment that is required for graduation. Black students score significantly lower on these tests, even after controlling for poverty. Figure 7 shows predicted HSA Algebra scores. Students with average levels of poverty in average poverty schools (red bars) have the highest predicted HSA Algebra scores.Students with high levels of poverty in average poverty schools (yellow bars) are predicted to score 5 points lower than average students. Students with high levels of poverty in high poverty schools (blue bars) are predicted to score 9 points lower than similar students who also experienced longer durations of household poverty but attended schools with average concentrations of poverty, and 14 points lower than similar students with average poverty experiences (two-fifths of a standard deviation).
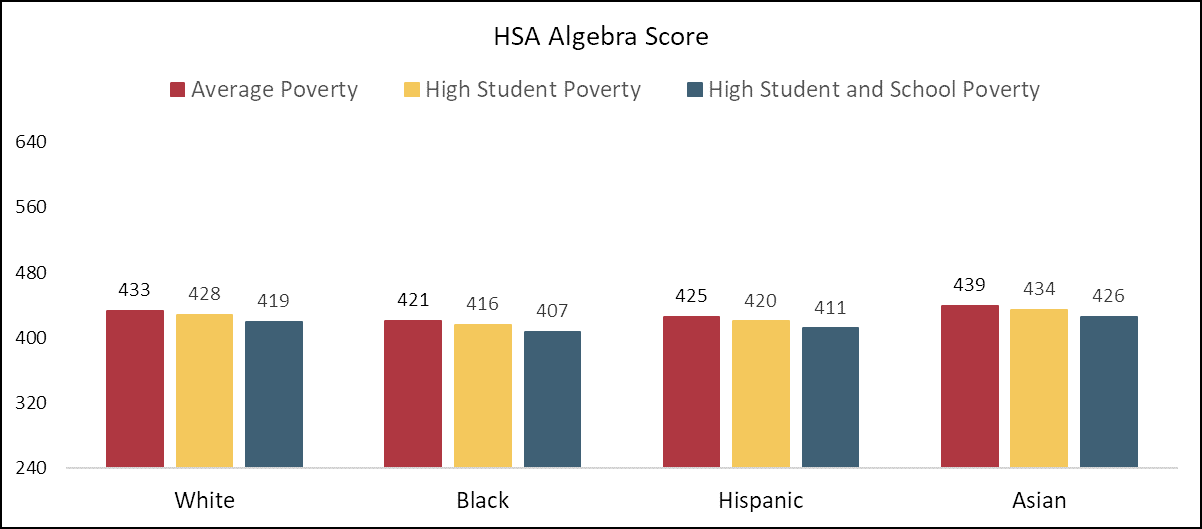
Figure 7.Predicted HSA Algebra score, by race/ethnicity and poverty (average poverty,high student poverty, and high student and school poverty), for students in schools with average racial/ethnic composition.
Overall, attending higher poverty schools means a student is less likely to enroll in college, even if they graduate on time from high school. Figure 8 shows the predicted likelihood of college enrollment. The probability of enrolling in college declines with higher durations of household poverty as well as with higher concentrations of poverty at school. Among Hispanic students, for example, a student with average poverty experiences (red bar) has a 74% likelihood of enrolling in college within a year of graduating from high school, but a student with longer experiences with poverty at home and attending schools with higher-poverty peers (blue bar) has only a 53%likelihood – not much better than a 50-50 chance.
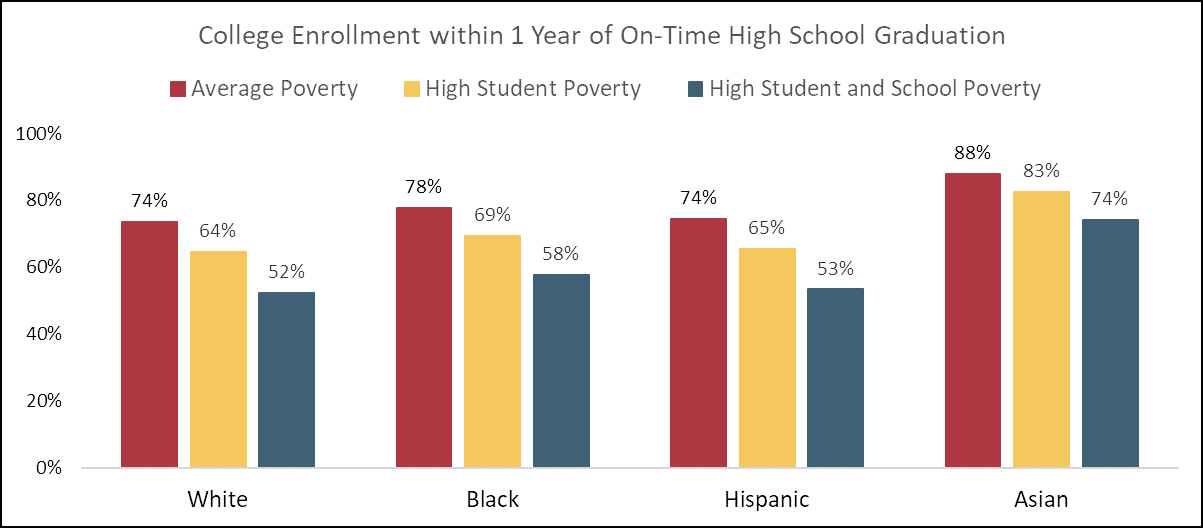
Figure 8.Predicted likelihood of college enrollment within 1 year of on-time high school graduation, by race/ethnicity and poverty (average poverty, high student poverty, and high student and school poverty), for students in schools with average racial/ethnic composition.
Patterns for wages were different than patterns for educational outcomes. Black students earn significantly less than students from other racial/ethnic backgrounds,even after controlling for poverty and school composition. Figure 9 shows the predicted total wages for the entire 1st year after on-time high school graduation for students who were not enrolled in college at all during this time. While longer experiences with household poverty (yellow bars) during grades 6-12 predicted slightly lower wages (about 4% lower for those with high student poverty), attending higher-poverty schools (blue bars) was associated with slightly higher wages (although this increase was not statistically significant).
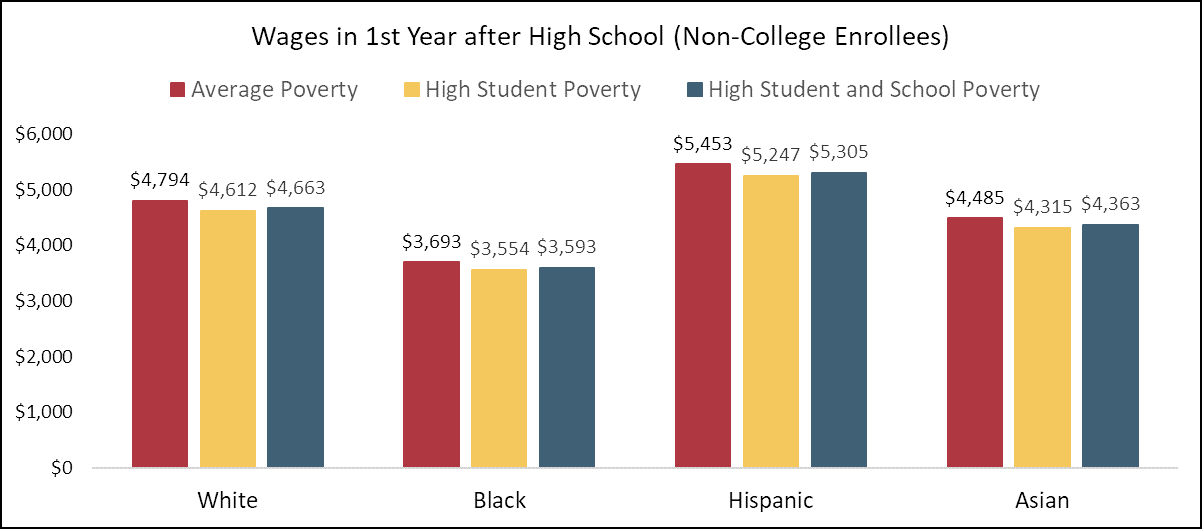
Figure 9. Predicted wages in 1st year after high school(non-college enrollees), by race/ethnicity and poverty (average poverty, high student poverty, and high student and school poverty), for students in schools with average racial/ethnic composition.
Being enrolled in college classes means less time available for working in a job. People from impoverished households, however, may need to work more in order to pay for college expenses. Figure 10 shows the predicted total wages for the entire 1st year after on-time high school graduation for students who were enrolled in college. As you might expect, students with higher student poverty (yellow bars) are predicted to earn more money while enrolled in college (the MLDS Center does not have data on hours worked – just total wages). But somewhat surprisingly, attending higher poverty schools also predicts higher wages (blue bars) – even for people who didn’t experience poverty at home. Perhaps having school or neighborhood peers who work during college leads young people to work even though they might not need to. Overall,race/ethnicity plays a large role in predicted wages. The MLDS Center research team is conducting further research on the roles of race/ethnicity, poverty,and college enrollment in the wages people earn.
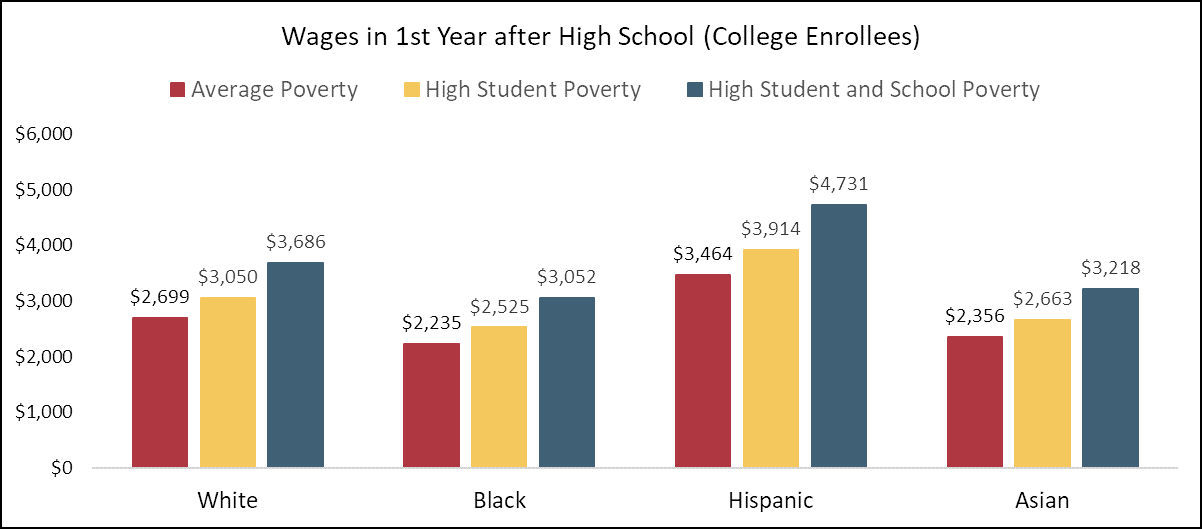
Figure 10. Predicted wages in 1st year after high school(college enrollees), by race/ethnicity and poverty (average poverty, high student poverty, and high student and school poverty), for students in schools with average racial/ethnic compositions.