Major and wages
The major or course of study has an impact on the wages of the Certificate Graduates with continuous wages. At age 25, Certificate Graduates who majored in Health & Medicine, Public & Social Services, Science, Math & Technology, and Trade & Personal Services, had median quarterly wages that were above the living wage.[4] The remaining majors were just below the living wage, or in the case of Social Sciences and Multi/Interdisciplinary majors, approximately $1,500 below the living wage (see Chart 2).
CHART 2: Median quarterly wage at age 25 by postsecondary certificate major

Over half of the high school graduates who earned an postsecondary certificate and had continuous wages majored in Health & Medicine or Public & Social Services. The Certificate Graduates who majored in Health & Medicine had a median quarterly wage of $7,600, which is approximately $500 over the quarterly living wage amount (red line in Chart 2).
The Public & Social Services majors had a median quarterly wage of $13,515, which is $6,000 higher than the Health & Medicine majors and $6,500 over the quarterly living wage amount. In fact the Public & Social Services majors had the highest median quarterly wage of all majors and their median is even above the median quarterly wages for all Marylanders [5]. The Public & Social Services majors include positions in law enforcement, firefighting, legal studies, social work, military studies and citizenship activities.
GENDER and Wages
There is a notable amount of variation in median quarterly wages when gender is taken into consideration (see Chart 3). Overall, women make up 52% of the Certificate Graduates with continuous wages at age 25. Their median earnings are $7,667, which is almost $2,000 less than their male counterparts.
chart 3: Median quarterly wage at age 25 by postsecondary certificate major and Gender
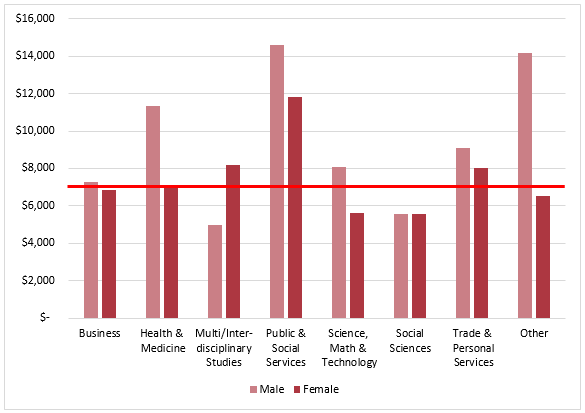
The wage difference persists even when comparing outcomes for the same major. For example, males make up 73% of the Certificate Graduates who majored in Public & Social Services and have continuous wages at age 25. Their quarterly wages were $1,600 more than their female counterparts. For Health &Medicine, females comprised 86% of the Certificate Graduates with continuous employment, and their median quarterly earnings were less than the male Certificate Graduates by over $4,000. In fact, men had higher median wages for all majors except Multi/Interdisciplinary, where the women’s median quarterly wages were over $3,000 higher.
RACE and wages
Because of the small sample size, this analysis was limited to a comparison of the median quarterly wages of White and African American Certificate Graduates with continuous wages at age 25. Overall, African Americans make up only 28% of the Certificate Graduates with continuous wages. Their median quarterly wages were almost $9,000, which is approximately $1,000 less than their White counterparts (see Chart 4).
chart 4: Median quarterly wage at age 25 by postsecondary certificate major and race
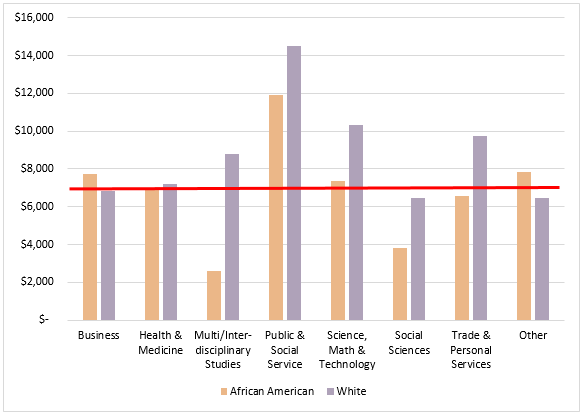
This pattern holds true when analyzing wages by major (see Chart 4). At age 25, White Certificate Graduates median quarterly wages were higher than their African American counterparts in all majors except Business and Other. In the two largest majors, Health & Medicine and Public & Social Services, White Certificate Graduates had higher median quarterly wages at age 25. For Health & Medicine, Whites made up 80% of the Certificate Graduates with continuous wages and earned a median quarterly wage that was $320 higher than their African American counterparts. For Public & Social Services, Whites made up 62% of the Certificate Graduates with continuous wages and earned a median quarterly wage that was $2,600 higher.