industry and wages
With only two exceptions, all of the industries in which Certificate Graduates with continuous wages at age 25 were employed had a median quarterly wage that was over the living wage amount. The two exceptions were Leisure & Hospitality and Other Services (see Chart 5)[6].
Chart 5. Median quarterly wage at age 25 by industry
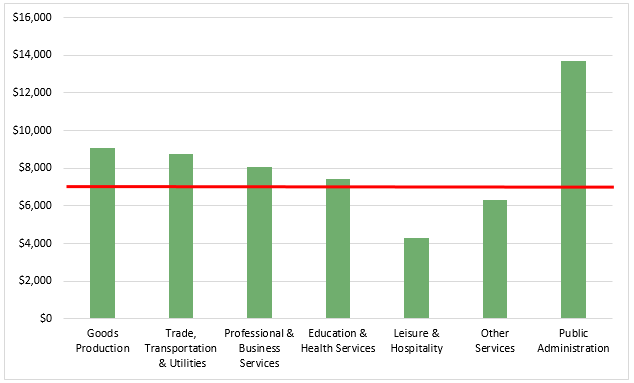
The two industry sectors with the most Certificate Graduates with continuous employment were Public Administration and Education & Health. These sectors correspond with the two most frequent majors: Public & Social Service and Health & Medicine.
The Certificate Graduates in Public Administration sector had the highest quarterly median wages at age 25 – close $14,000 – which is almost double the living wage and $4,000 higher than the median quarterly earnings for all Marylanders [7]. Jobs in this Public Administration sector include a variety of different public sector administrative jobs, including police protection, correctional institutions, parole and probation officers, fire protection, and other safety activities.
The Certificate Graduates in the Education and Health sector had a median quarterly wage of $7,400, which is also above the living wage, but below the median quarterly earnings for all Marylanders. The Education and Health sector includes (1) all facets of the health care industry including physician and other health practitioner offices, outpatient care centers, home health care services, hospitals, community centers, residential care facilities, and child day care services and (2) all facets of education including elementary and secondary schools[8], higher education institutions, technical and business training schools, and other educational support services.
gender and wages
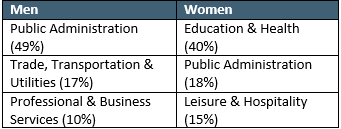
The top sectors of employment for Certificate Graduates at age 25 with continuous employment varies by gender (see Table 2), with the top sector for men being Public Administration and the top sector for women being Education &Health. The second highest sector for women is Public Administration followed by Leisure & Hospitality, which also had the lowest median quarterly wages of all the sectors. For men, the second highest sector was Trade, Transportation & Utilities, followed by Professional & Business Services.
Table 2.top industries by gender
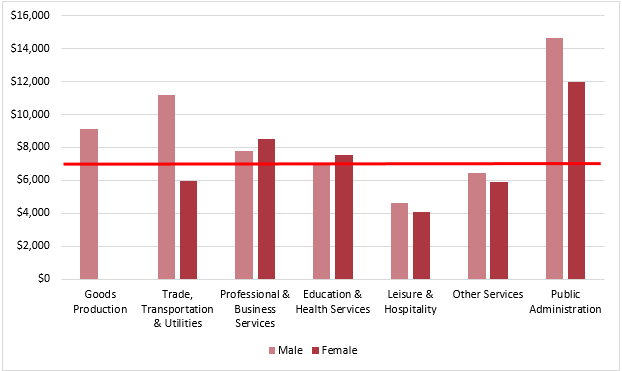
Female Certificate Graduates with continuous wages in the Professional & Business and Education & Health sectors had a slightly higher median quarterly wage at age 25 compared to their male counterparts by approximately $750 and $500, respectively (see Chart 6).
The opposite is true for the Leisure & Hospitality and Other Services sectors where the median quarterly wage for men was $550 higher in each sector than it was the women's median. Notably, in both of those sectors, the median quarterly wage for both the men and the women was less than the living wage. Finally, the largest wage gap occurs in the Trade, Transportation & Utilities and the Public Administration sectors. In those two sectors respectively, men had a median quarterly wage that was approximately $6,000 and $7,500 higher than the women's median.
Chart 6. Median quarterly wage at age 25 by industry and gender
race and wages
Because of the small sample size, this analysis was limited to a comparison of the median earnings of White and African American Certificate Graduates with continuous wages. Overall, African American Certificate Graduates with continuous wages at age 25 make up only 28% of the Certificate Graduates with continuous wages. Generally, when comparing wages by sector, African American Certificate Graduates have lower quarterly median wages than their White counterparts except in the Education & Health and Other Services sectors(see Chart 7).
Chart 7. Median quarterly wage at age 25 by industry and race
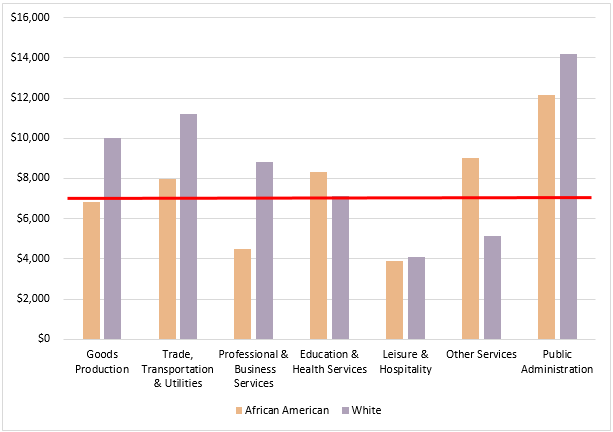
The two sectors with the most Certificate Graduates, Education & Health and Public Administration, had varied wage outcomes by race.
In the Education & Health sector, African American Certificate Graduates with continuous wages had a median quarterly wage that was approximately $1,200 higher than their White counterparts at age 25. As such, the median wage for African Americans was over the living wage while the median wage for White Certificate Graduates was below the living wage.
In contrast, in the Public Administration sector, White Certificate Graduates had a median quarterly wage that was over $2,000 higher than their African American counterparts. In this sector, both African Americans and Whites had a median quarterly wage that was well over the living wage amount, but only White Certificate Graduates had a median quarter wage that was also over the median quarterly wage for all Marylanders.
postsecondary certificate graduates
Select from an option below to view Certificate graduates wages by major, the methodology used for this report or to return to the overview.