STUDENT LOANS AND WAGES FOR HIGH SCHOOL GRADUATES

          EXCERPTS FROM THE CAREER PREPARATION EXPANSION ACT REPORT, 2019

OVERVIEW

The Maryland Longitudinal Data System (MLDS) Center and the Governor’s Workforce Development Board (GWDB) are required to annually produce the Career Preparation Expansion Act report on the wages and sector of employment of high school graduates for the five-year period after graduation. This year's report included a supplement that focused on high school graduates who continued on to college and either graduated with a degree or discontinued their education without graduating, have student loans, and are fully engaged in the workforce five years after high school.  

This analysis is not a comprehensive study on student loans, rather, it provides additional insight into the financial resources required to cover both the cost of living and fulfill the financial obligations of a student loan.

Of the approximately 60,000 high school students that graduated from a Maryland public school in 2013, over 33,000 either graduated from college with an Associate's or Bachelor's degree or discontinued their education without graduating five years after college[1].

The student loan [2] amounts for 5,000 were evaluated in the context of their wages.  These students were selected as they were fully-engaged in the workforce five years after high school graduation[3].

The percentage of students in each educational attainment group that had student loans varied from a low of 28% (Associate’s) to a high of 38% (Bachelor’s).  See Table A.

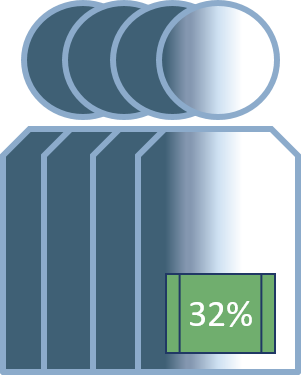
32% of students with an Associate's degree, Bachelor's degree or Some College with full-quarter wages [3] have a student loan.

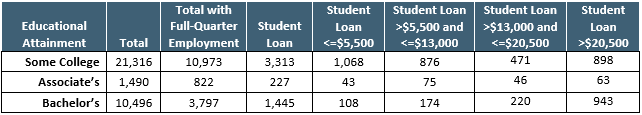
Table A. High School Graduates, State of Maryland, 2013, Full-Quarter Employment and Student Loans, Five Years after High School Graduation

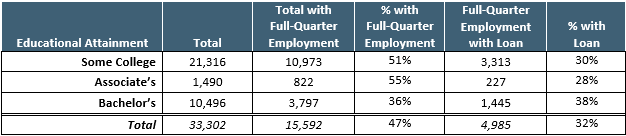
The slightly lower rate for student loans for Associate’s students (Table A) is not surprising as these programs are typically two years in length and offered at community colleges. The short term of enrollment and the low tuition rates most likely decreased reliance on student loans to finance the education costs.

Conversely, those in the Some College or Bachelor’s (Table A) groups had longer periods of enrollment and/or paid higher tuition rates which most likely increased reliance on student loans to cover education costs.  These results, particularly for Some College and Bachelor’s, should be viewed with caution.  Approximately 27% of Maryland high school graduates enroll in college out-of-state and student loan data are not available for these students, therefore the actual number of students with loans is likely higher than what is reported here.

Table B. High School Graduates, State of Maryland, 2013,Full-Quarter Employment and Student Loans, Five Years after High School Graduation

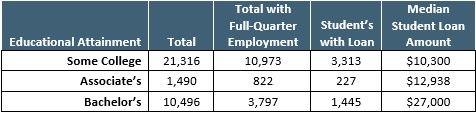
The median loan amount for each educational attainment group varied widely [4].  See Table B. The median was lowest for Some College, around $10,000, and highest for Bachelor’s, around $27,000. The median for the Associate’s group fell in between, around $12,000.  These medians align to the loan limits that the federal government establishes for each year of college enrollment. For example, the current federal student loan limit for first year undergraduates is $5,500 and for second year is $6,500, therefore a student with two years of undergraduate study, like those in an Associate’s degree program, may have a maximum federal loan amount of $12,000.  

Table C. High School Graduates, State of Maryland, 2013, Full-Quarter Employment and Student Loans by Student Loan Band and Educational Attainment, Five Years after High School Graduation

Not all students elect to receive a loan as part of their financial aid each year. Some student may elect to receive a loan during one year to cover a funding gap and decline the loan other years.  Similarly, students may opt to receive a loan each year but for an amount less than the loan limit.   Alternatively, students may demonstrate financial hardship so that they may receive loans in excess of the standard limits. Students with full-quarter employment and loans were grouped into loan amount categories that approximated annual funding limits for undergraduates.   See Table C.  

The distributions in Table C reveal both expected and unexpected patterns.  For example, it is not surprising to see the vast majority (80%) of students with loans in the Bachelor’s group in the loan band for loans exceeding $20,500.  A bachelor’s degree requires a minimum of four years of study which, if a student received the maximum allowable in a federal loan each year will result in aggregate loans in excess of $20,000 ($5,000 to $6,000 per year for four years).

An unexpected pattern appears with the Associate’s degree group.  Students in this group are enrolled in a program that requires 2 years of full-time study, yet the population with student loans is fairly equally split between students with less than $13,000 and more than $13,000. This may indicate that half of the Associate’s degree students were either 1) enrolled part-time (extending time to degree and receiving additional years of loans) 2) had to repeat (and pay for) courses that were failed on a first attempt, or took courses not needed for their degree, or 3) had PLUS loans or other private loans that resulted in larger than expected student loan amounts.  

This pattern is also present in the Some College group.  One-third of students with loans in this group had aggregate loan amounts that suggest an enrollment period of only one year (<$5,500); however 41% of students in this group had aggregate loans that suggest these students were enrolled in college for multiple years or received loans with higher annual maximums, such as private loans and PLUS loans.  

student loan Payments and wages
by educational attainment

The sections below explore the relationship between wages, student loan payments, and the cost of living in Maryland for those with a college degree or some college, but no degree.  For a more detail description of the methods guiding this study select METHODOLOGY.

Data Limitations and Definitions:
[1] An additional 14,226 students enrolled in college and were still in college five years after high school graduation. Graduates that were still in college were omitted form this analysis because these students may still be accruing loans, they are not yet fully engaged in the workforce in career track employment, and their in-school status means that they are not yet required to make student loan payments. High school graduates who earned a postsecondary Certificate (269) or other degree (59) were omitted from the analysis due to the small population sizes.

[2] Students with full-quarter wages were evaluated to determine if they had ever received a Federal Perkins loan, William D. Ford Subsidized Direct Loans, Federal Unsubsidized Stafford Loans, PLUS Loan (Parent Loan for Undergraduate Students), and Other federal, institutional or private loans. These types of loans involve funds paid to the college where the student is enrolled.  The funds are then applied to a student’s account balance.  Excess funds are either returned to the funder or provided to the student to cover expenses that are not billed through the college (such as rent, food, gas,etc.).   It is possible that students (or their parents) have other private loans where funds are paid directly to the student (or parent) rather than the college. This information is not available to include in this analysis.

[3] The high school graduates included in the wage analysis were selected by using the U. S. Census Bureau Stable or Full-Quarter Employment Methodology (referenced as Full-Quarter throughout this report). This methodology excludes individuals who do not have wage data in either the fiscal quarter before or after the period of interest.  For this study, the period of interest is the 20th quarter after high school graduation or fiscal quarter 2 of 2018.  Accordingly,individuals weif,in addition to having wages in quarter 2 of 2018, they also had wages in fiscal quarter 1 of 2018 and fiscal quarter 3 of 2018.   estricting analysis to “stable wage earners” provides a clearer picture of wage outcomes for workers fully engaged in the workforce and eliminates the potential to deflate median wage calculations by including the wages, or lack of wages, of workers for who are absent, transient, or not fully engaged in the workforce.   https://lehd.ces.census.gov/doc/QWI_101.pdf.

[4] This amount may be from one college or multiple colleges.  Due to variations in institutional practices,the amounts recorded for loans may reflect awards, disbursements or net disbursements.  Awards reflect monies intended to be paid to a student. Disbursements reflect actual monies paid to a student.  Net disbursements reflect monies paid and monies refunded.  This variation means that loan amounts may be overstated and not reflect the actual loan obligation.