Wage Visibility for Full-Time Undergraduate Students in Maryland’s state-aided independent institutions
state-aided independent results
Maryland has thirteen State-Aided Independent institutions. These institutions range from large research universities to small liberal arts colleges.
The average rate of wage visibility in the fall term for enrollees[1] at Maryland’s State Aided-Independent colleges was 17%[2], seventeen percentage points below the state average.
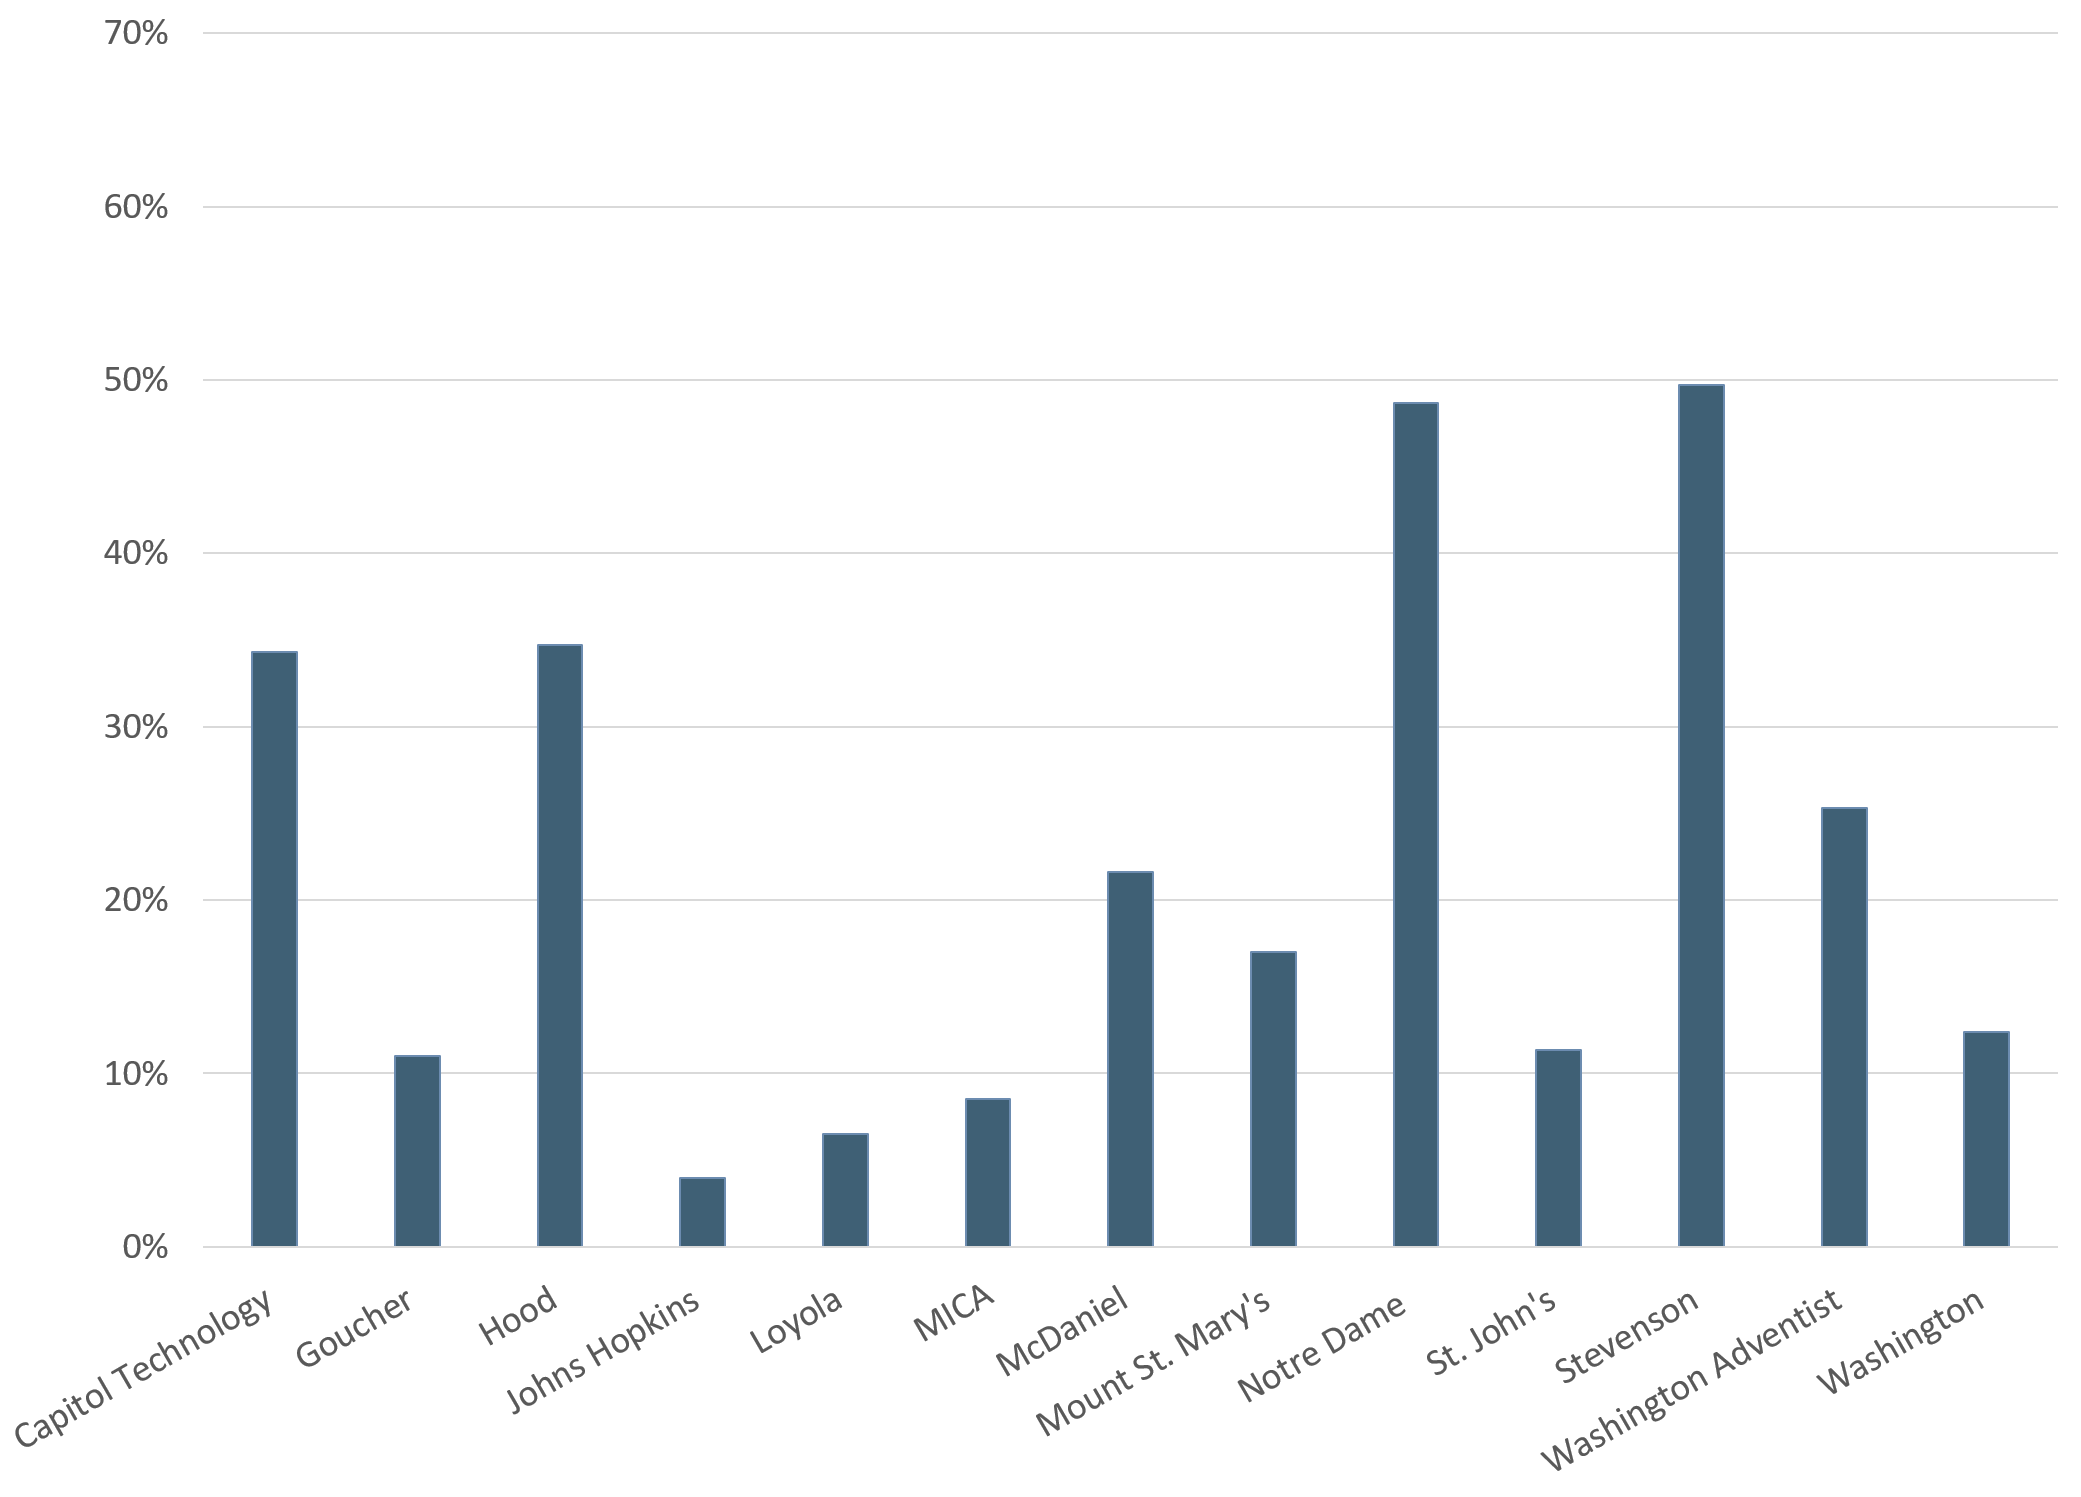
The rate of variation in wage visibility was also quite pronounced. Only 4% of enrollees at Johns Hopkins University were visible in the wage data for fall, while 50% of enrollees at Stevenson University were visible.
The vast majority of these student worked in either the Trade, Transportation and Utilities sector[3] or the Leisure and Hospitality sector[3].
Trade, Transportation and Utilities (23%)
Leisure and Hospitality (26%)
Education and Health Services (32%)
Professional and Business Services (8%)
All Other Sectors (11%)
Additionally, 63% of students without a wage record either participated in work-study (6%), received an institutional scholarship (49%), or both (9%) during the fall 2017 term. While the work-study students were engaged in the workforce in a part-time capacity, some of the students receiving an institutional scholarship may also have had some level of engagement in the workforce.
wage visibility by state-aided independent institution, fall 2017
Data Limitations and Definitions: [1] Enrollees are defined as students pursuing an Associate’s or Bachelor’s degree full-time in the Fall 2017. Enrollments are not mutually exclusive, some enrollees are concurrently enrolled at more than one college. Further, students enrolled in the fall may or may not have been enrolled in the spring; however, they are still counted in wage visibility. [2] Wage data are effective through September 2018. MLDSC wage data are derived from Unemployment Insurance reporting and do not include information on military service, apprenticeships, self-employment, out-of-state employment or Federal Government employment. Enrollees may also be employed in work-study positions at their campuses that are not subject to UI wage reporting. These gaps in wage data mean it is incorrect to assume that college enrollees not counted as “employed” are unemployed. Enrollees were counted as visible in the wage data if they had a wage record in Q3 of 2017 and Q4 of 2017. These wage periods cover July through September (Q3) and October to December (Q4). Using both Q3 and Q4 to evaluate wage visibility helps minimize the appearance of enrollees in the wage data who may have only worked in the summer leading up to the fall term or over the term break in December.
[3] Unemployment Insurance data contain the sector of the employer not the job of the employee. Each record contains the North American Industry Classification System (NAICS) code for the employer. NAICS was developed by the Office of Management and Budget (OMB), and adopted in 1997. It is the standard used for federal reporting. An enrollee was count with the NAICS reported in fiscal quarter 3. The NAICS reported in fiscal quarter 4 may or may not have been the same as that reported in quarter 3.